Debugger
Forge ships with an interactive debugger.
The debugger is accessible on forge debug and on forge test.
Using forge test:
$ forge test --debug $FUNC
Where $FUNC is the signature of the function you want to debug. For example:
$ forge test --debug "testSomething()"
If you have multiple contracts with the same function name, you need to limit the matching functions down to only one case using --match-path and --match-contract.
If the matching test is a fuzz test, the debugger will open the first failing fuzz scenario, or the last successful one, whichever comes first.
Using forge debug:
$ forge debug --debug $FILE --sig $FUNC
Where $FILE is the path to the contract you want to debug, and $FUNC is the signature of the function you want to debug. For example:
$ forge debug --debug src/SomeContract.sol --sig "myFunc(uint256,string)" 123 "hello"
You can also specify raw calldata using --sig instead of a function signature.
If your source file contains more than one contract, specify the contract you want to debug using the --target-contract flag.
Debugger layout
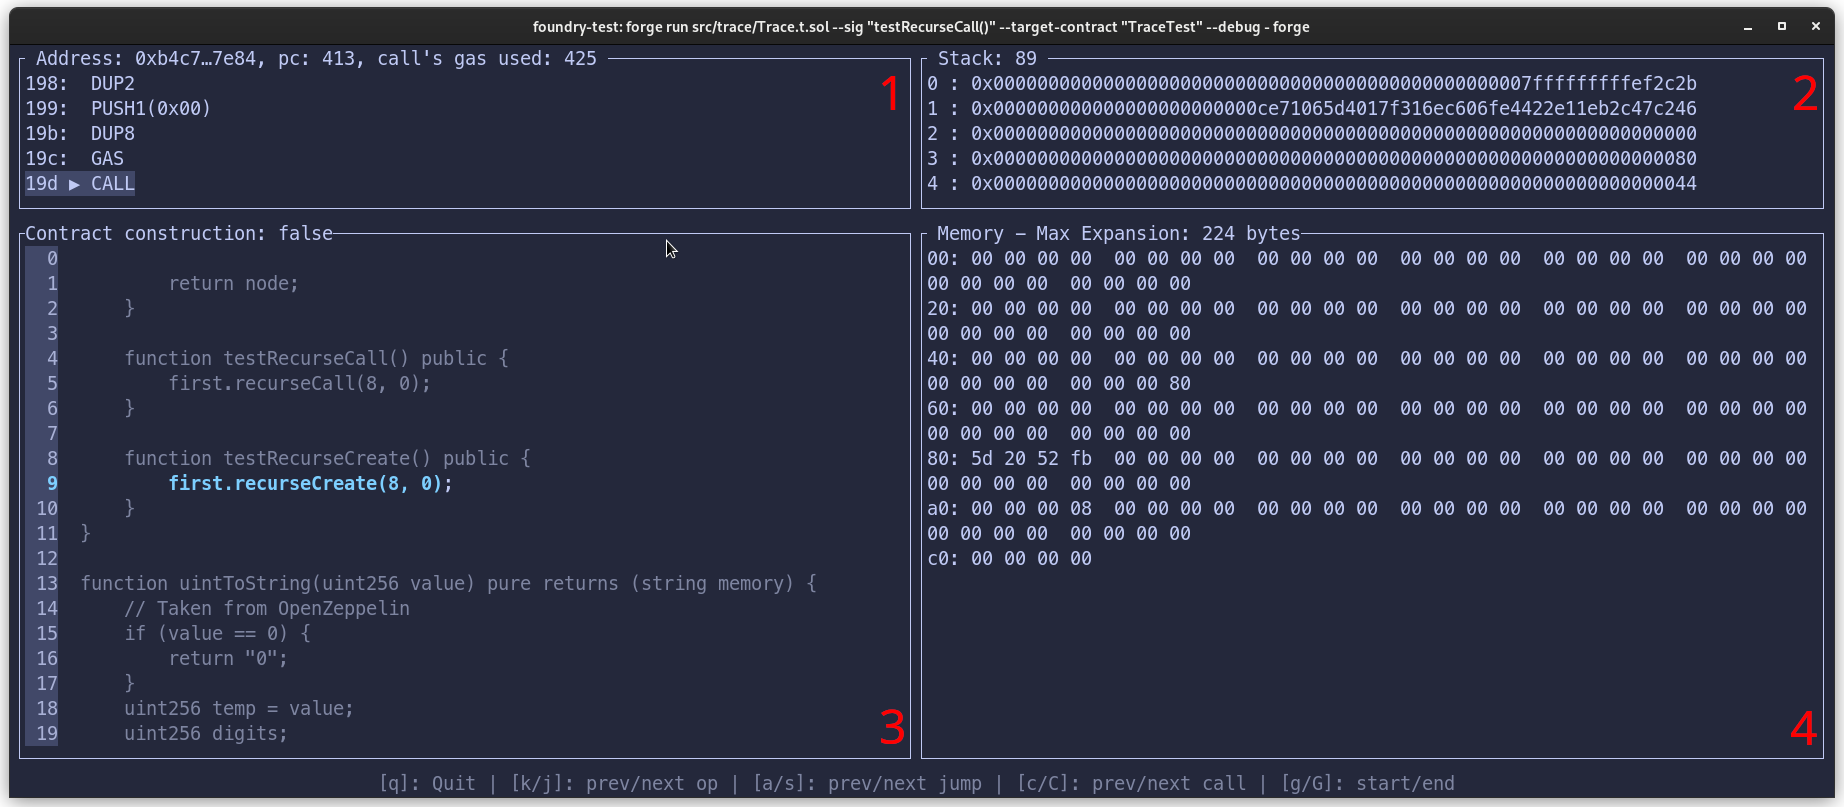
When the debugger is run, you are presented with a terminal divided into four quadrants:
- Quadrant 1: The opcodes in the debugging session, with the current opcode highlighted. Additionally, the address of the current account, the program counter and the accumulated gas usage is also displayed
- Quadrant 2: The current stack, as well as the size of the stack
- Quadrant 3: The source view
- Quadrant 4: The current memory of the EVM
As you step through your code, you will notice that the words in the stack and memory sometimes change color.
For the memory:
- Red words are about to be written to by the current opcode
- Green words were written to by the previous opcode
- Cyan words are being read by the current opcode
For the stack, cyan words are either being read or popped by the current opcode.
Navigating
General
- q: Quit the debugger
- h: Show help
Navigating calls
- 0-9 + k: Step a number of times backwards (alternatively scroll up with your mouse)
- 0-9 + j: Step a number of times forwards (alternatively scroll down with your mouse)
- g: Move to the beginning of the transaction
- G: Move to the end of the transaction
- c: Move to the previous call-type instruction (i.e.
CALL,STATICCALL,DELEGATECALL, andCALLCODE). - C: Move to the next call-type instruction
- a: Move to the previous
JUMPorJUMPIinstruction - s: Move to the next
JUMPDESTinstruction - ' + a-z: Move to
<char>breakpoint set by avm.breakpointcheatcode
Navigating memory
- Ctrl + j: Scroll the memory view down
- Ctrl + k: Scroll the memory view up
- m: Show memory as UTF8
Navigating the stack
- J: Scroll the stack view down
- K: Scroll the stack view up
- t: Show labels on the stack to see what items the current op will consume